

Introduction
Market makers, equipped with high-frequency trading capabilities, institutional-grade cost structures, and real-time creation/redemption privileges, are the primary participants in ETF premium–discount arbitrage. In contrast, Non-Institutional Participants face multiple constraints—including information latency and higher transaction frictions—which make it difficult to capture arbitrage opportunities promptly or profitably.
Using the Yuanta Taiwan 50 ETF (0050) as a primary case study, this research simulates the execution of premium–discount arbitrage for these two distinct market participants based on historical empirical data. By comparing performance under varying entry/exit thresholds and cost structures—and evaluating metrics such as hit rates, return distributions, and drawdown risks—we aim to clarify an essential question: In this seemingly “risk-free arbitrage,” who truly captures the opportunity and earns consistent alpha in the Taiwan market?
📊Use our Factor Library to find alpha and optimize investment strategies
Market Context & Research Framework
Taiwan ETF Market Characteristics
The empirical analysis incorporates the following structural features unique to the Taiwan capital market:
- In-Kind Creation/Redemption: The 0050 ETF primarily utilizes an in-kind mechanism, enabling institutional participants to execute arbitrage between the primary and secondary markets using equity baskets.
- Settlement Cycle: Transactions follow a T+2 settlement protocol.
- Preferential Tax Structure: The Securities Transaction Tax for ETFs is significantly incentivized at 0.1%, compared to the 0.3% levied on individual equities.
Case Subject: Yuanta Taiwan 50 ETF (0050)
AUM (Assets Under Management): As of January 2025, the AUM stood at approximately NT$ 440 billion, maintaining its position as the most liquid and benchmark-representative ETF in Taiwan.
Underlying Index: TSEC Taiwan 50 Index (comprising the top 50 companies by market capitalization).
Empirical Setting (Research Design)
The quantitative data retrieved via TEJ . This ensures cross-period consistency through standardized corporate actions and high-fidelity price adjustments.
- Universe: Yuanta Taiwan 50 ETF (0050.TW).
- Backtesting Period: January 1, 2010 – June 9, 2025.
- Strategy Frequency: Daily rebalancing.
- Note: This study evaluates long-term structural profitability; while intraday arbitrage exists on a sub-minute scale, this model captures the mean-reversion of daily closing premiums.
- Initial Capital: NT$ 10 Million.
- Cost Assumptions:
- Market Makers: Near-zero effective transaction costs under Taiwan’s market-making and tax framework.
- Non-Institutional: 0.1425% commission (Buy/Sell) + 0.1% Transaction Tax (Sell).
- Execution Friction: Estimated at 1 Tick slippage per trade.
- Leverage Constraint: 0.9 (Total exposure capped at 90% of account equity to manage liquidity).
Formation of ETF Premiums/Discounts and the Arbitrage Mechanism
Arbitrage Mechanism & Strategy Logic
Signal Standardization
The strategy utilizes the Premium/Discount Ratio defined as follow, rather than absolute price spreads.
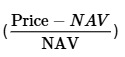
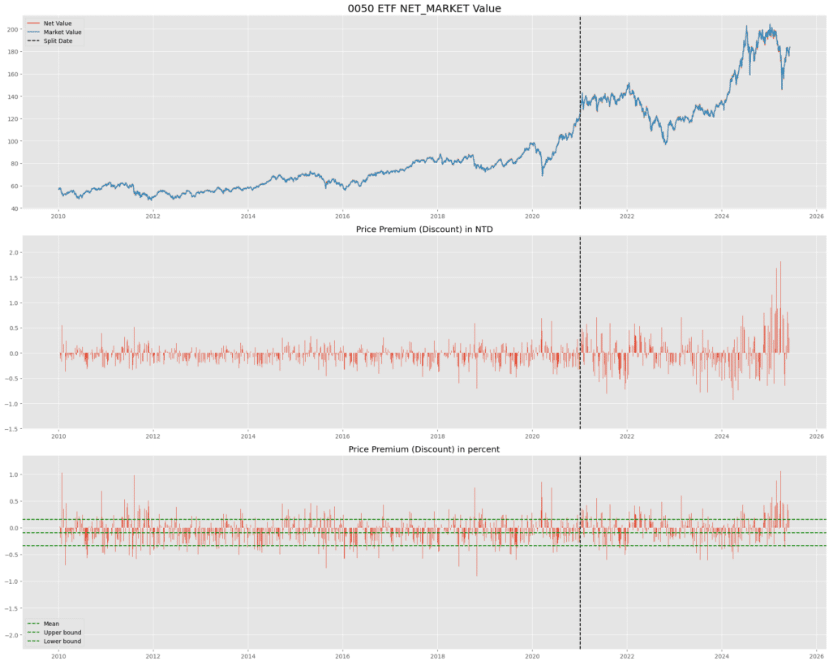
This approach normalizes the signal, ensuring consistent volatility sensitivity across the ETF’s decade-long price appreciation (from ~NT$50 to >NT$150).
Parameter Robustness
To strictly mitigate look-ahead bias, the model employs a static parameter approach:
- In-Sample (Pre-2020): Used exclusively to calculate baseline statistics (Mean & Standard Deviation).
- Out-of-Sample (2021–2025): Trading signals are generated using these fixed historical parameters, serving as a stress test for strategy stability.
Execution Logic (Standard Deviation Thresholds)
The strategy exploits Mean Reversion when the ratio deviates significantly from the historical mean. Two distinct thresholds are tested to reflect different cost structures:
- Market Makers (Threshold±1σ):Assumes zero transaction costs. This low threshold captures frequent, minor price dislocations consistent with a liquidity provider’s role.
- Non-Institutional (Threshold±3σ):Requires a widened spread to buffer against execution friction (0.1425% Commission + 0.1% Tax). A trade is only triggered when the deviation is statistically extreme enough to offset these costs.
Return Attribution Methodology
To isolate the source of Alpha, the strategy decomposes returns into two components:
- NAV Leg:Returns derived from holding the underlying basket (or shorting it).
- Price Leg:Returns derived from the mean reversion of the ETF market price.
This decomposition allows us to verify whether profits originate from fundamental value adjustments (NAV) or liquidity-driven price corrections (Market Price).
Figure 1: Long-Term Price & Premium/Discount Structure of Yuanta Taiwan 50 (0050)
💡Further Reading: TCRI Watchdog master credit risks with daily monitoring to bridge financial reporting gaps
Empirical Results: Market Maker Perspective
The Structural Advantage (1-SD Threshold)
Market Makers (MM), benefiting from transaction tax exemptions and fee waivers, can effectively exploit minor deviations (±1σ).
Figure 2: Market Maker Strategy Performance (1-SD Threshold)
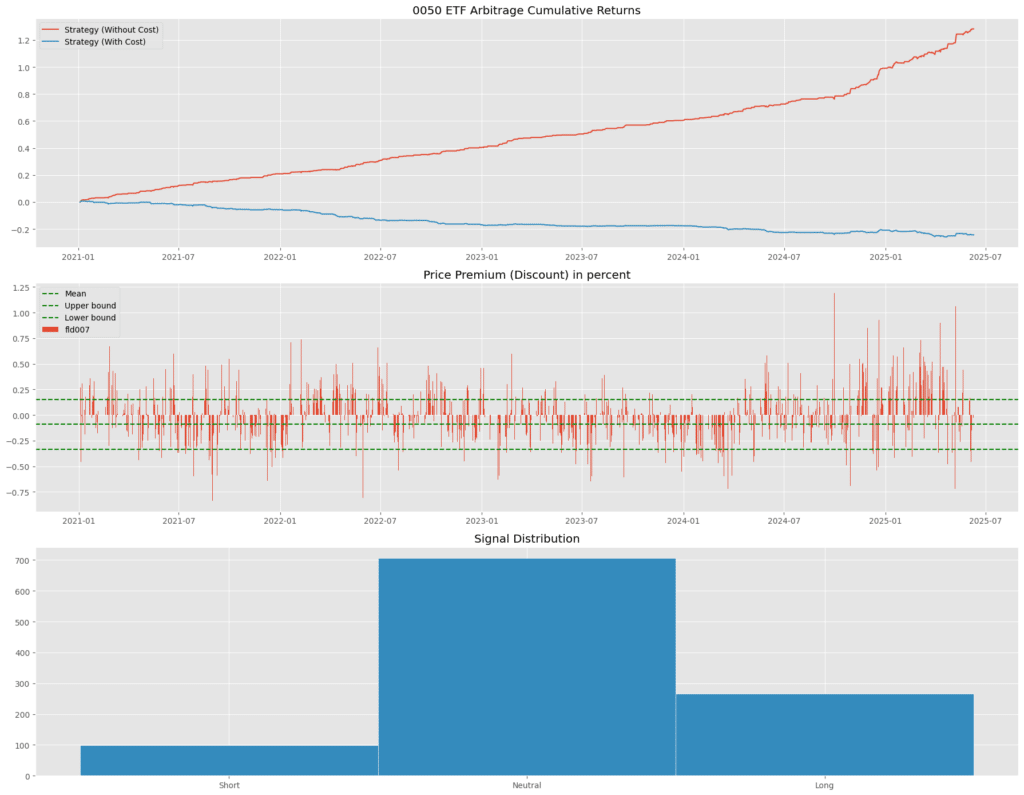
- Frictionless Alpha:As shown in the chart above (red line), the zero-cost strategy generates consistent positive returns. This confirms that the 0050 ETF offers abundant short-term mean-reversion opportunities.
- The Cost Barrier:The blue line demonstrates a counterfactual scenario: if standard transaction costs were applied to this high-frequency 1-SD strategy, the cumulative return would decline linearly. This proves that the “Alpha” in this zone is structural—it belongs exclusively to participants with market-making privileges.
Return Attribution: Price vs. NAV
Decomposing the profit sources reveals the mechanics of the arbitrage:
Figure 3: Return Attribution Analysis (NAV vs. Market Price)
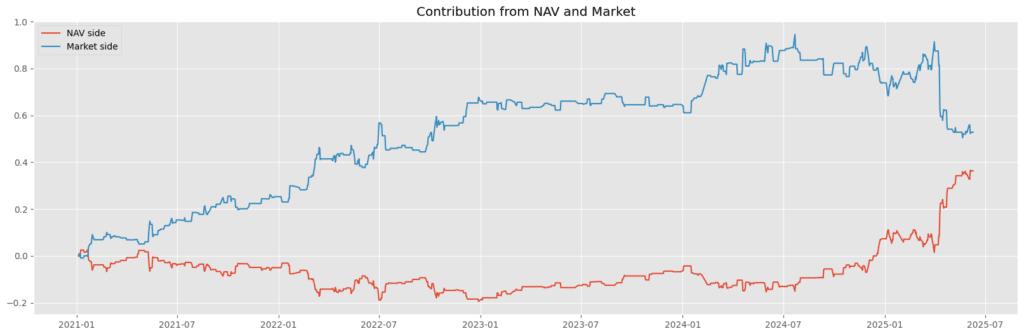
- Market Price Dominance:The majority of profits (Long MV / Short MV) are derived from the ETF’s market price converging back to fair value.
- NAV Lag:The NAV leg contributes negligibly or negatively. This aligns with market microstructure theory: ETF prices react to liquidity shocks and sentiment (creating the spread), while the basket (NAV) remains relatively stable. The arbitrage profit comes from correcting the market price inefficiency, not anticipating NAV movements.
Empirical Results: Non-Institutional Perspective
The Cost of Entry (3-SD Threshold)
For Non-Institutional participants, the strategy tightens the entry threshold to 3 Standard Deviations to buffer against the 0.1% Tax and commissions.
Figure 4: Non-Institutional Strategy Performance (3-SD Threshold)
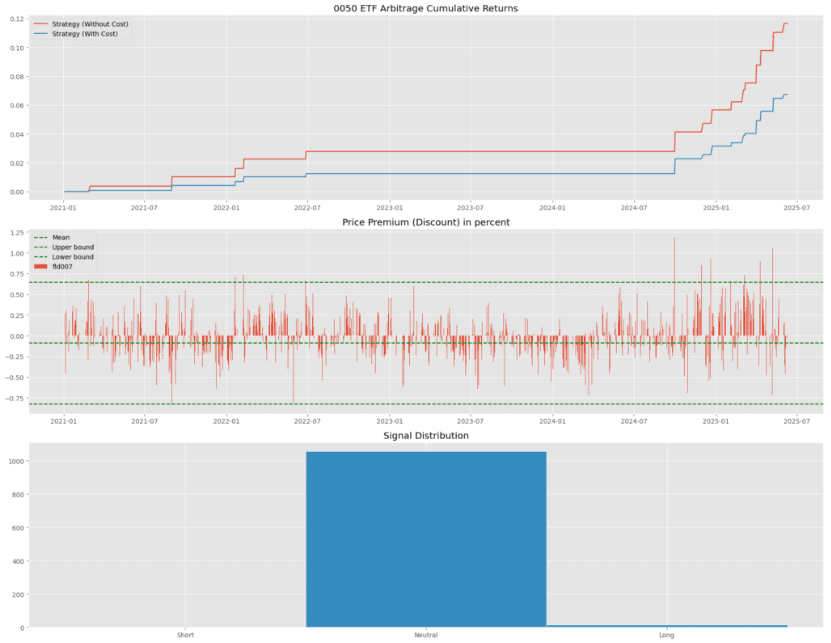
- Opportunity Scarcity:As illustrated, the strict 3-SD requirement filters out most trading signals. There is a notable “silence” in activity for extended periods, with valid signals highly concentrated after July 2024.
- Return Erosion:
- Gross Return: Reaches approximately 12% over the active period.
- Net Return: After accounting for friction, the cumulative net return drops to roughly 7%
- Capital Efficiency Analysis:While the “Hit Ratio” (Win Rate) per trade is high, the capital utilization is extremely low. For an institutional allocator, locking up capital for a 7% total return over this specific timeframe—with long dormant periods—represents a suboptimal use of funds compared to risk-free bonds or a simple Buy-and-Hold strategy.
Performance Summary & Strategic Implication
To synthesize the empirical findings, the following table contrasts the structural and operational divergences between the two participant categories:
| Metric | Market Maker (1-SD) | Non-Institutional (3-SD) |
|---|---|---|
| Primary Advantage | Tax/Fee Exemption | None (Standard Costs) |
| Trading Logic | High Frequency Liquidity Provision | Opportunistic / Sniper |
| Trade Frequency | High (Continuous) | Very Low (Sparse) |
| Win Rate (Hit Ratio) | High | 100% (Observed sample window) |
| Profit Source | Volume x Small Spread | Occasional Extreme Mispricing |
| Capital Efficiency | High (Constant turnover) | Low (Capital idle for long periods) |
| Strategic Viability | Core Strategy | Inefficient (Better alternatives exist) |
The empirical data from the Taiwan market validates that ETF premium/discount arbitrage is not a democratic strategy.
For Market Makers, it represents a consistent, high-probability income stream derived from liquidity provision and structural tax advantages.
For Non-Institutional Investors, the strategy exhibits a clear form of ‘Negative Asymmetry.’ Transaction costs in Taiwan—particularly the bid-ask spread and securities transaction tax—effectively gatekeep the majority of arbitrage profits.
Outside of rare, extreme dislocations or scenarios requiring sub-minute intraday execution capabilities, a standard end-of-day mean reversion approach offers insufficient risk-adjusted returns for non-institutional participants.
Drive Institutional Alpha with Precision Market Intelligence
This research is empowered by TEJ Market Data—the authoritative source for Taiwan financial intelligence.
Ensure your models are built on truth with our precise Corporate Action Adjustments, Equity Pricing, and deep ETF Analytics.