

Photo by Jakub Żerdzicki on Unsplash
Data Sources and Taiwan Stock Market Framework
Taiwan’s Monthly Revenue Disclosure System
The Taiwan equity market possesses a rare institutional advantage globally: under the Securities and Exchange Act, listed companies are required to announce and report their operational results for the preceding month by the 10th of each month (Exception: starting from FY2026, insurance companies and entities with insurance subsidiaries may extend their disclosure deadline to the 15th of each month). This is commonly referred to in the market as “Monthly Revenue”.
Benefiting from this regulation, investors can update the latest corporate revenue information every month at a frequency far higher than quarterly financial report fundamental data. Monthly revenue stands as one of the most frequently utilized fundamental signals in quantitative research in Taiwan.
Data Sources and Processing Flow
The TEJ Monthly Revenue Database aggregates monthly operational disclosures of listed companies sourced from the Market Observation Post System (MOPS). To satisfy the data requirements of quantitative backtesting, the TEJ database strictly adheres to a Point-in-Time (PIT) timestamp architecture. It accurately captures data at the “earliest disclosure point” to reconstruct the authentic market reaction in real-time, while comprehensively preserving the historical disclosure trajectories generated by subsequent revision filings for the same revenue month.
Taking the revenue filing of stock 2236 Patec-KY in September 2025 (202509) as an example (Table 3-1), the TEJ PIT database fully records the initial announcement alongside subsequent revision trajectories for the same revenue month:
Table 3-1: Illustrative Example of “Initial Filing and Revision Trajectory for the Same Month” in TEJ PIT Monthly Revenue Database (Taking 2236 Patec-KY as an Example)
| Stock Code & Name | Revenue Month (YYMM) | Announcement Date | Monthly Revenue (NT$ Thousand) | Historical Remarks & PIT Implications |
| 2236 Patec | 202509 | 2025 / 10 / 13 | 739,569 | Initial Filing: The sole authentic data point available to the market on 2025/10/13. |
| 2236 Patec | 202509 | 2025 / 11 / 10 | 734,845 | Revision Record: Adjusted in accordance with CPA audit numbers, revising September revenue announcement downward. PIT trajectory fully retains both records. |
Figure 3-2: 2236 Patec-KY Discloses Revision of September 2025 Monthly Revenue on Market Observation Post System (MOPS)
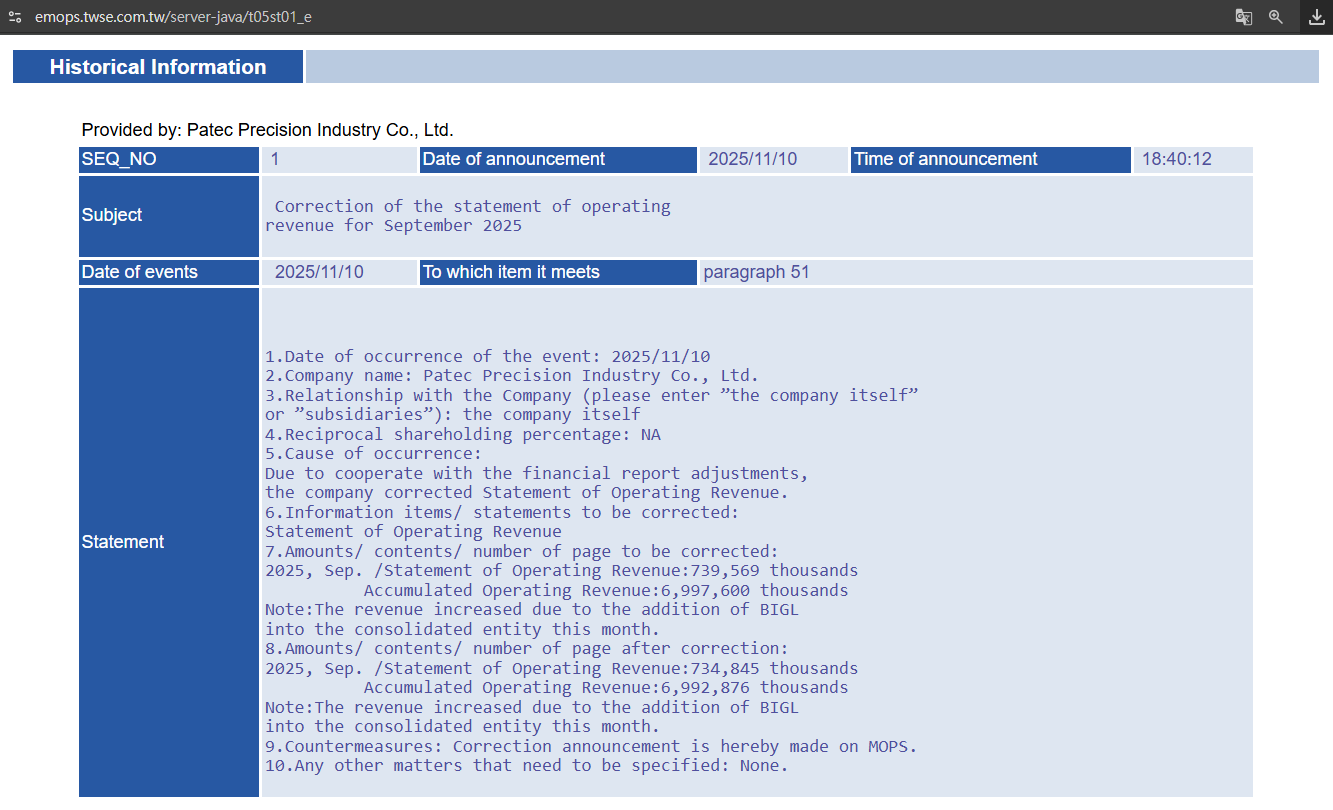
Table 3-1 shows Patec-KY initially reported September revenue at NT$739,569 thousand on 2025/10/13, then revised it down to NT$734,845 thousand on 2025/11/10 (Figure 3-2).
Without a PIT mechanism, overwriting the initial data causes look-ahead bias by using future revisions during backtests from 10/13 to 11/09. The TEJ PIT database retains the original 2025/10/13 release date and figure, ensuring backtests only access historically available data.
Additionally, the database keeps historical data for delisted stocks, eliminating survivorship bias.
Quantitative Factor Research
Introduction
Utilizing fundamental data to forecast equity returns has long been a cornerstone of quantitative investing. Do multi-factor portfolios genuinely outperform single-factor models? If so, which specific factor drives the contribution? This study focuses on two fundamental factors built upon monthly revenue: “SURPS3MTA”, which measures revenue momentum, and “REVOPY”, which measures operating profit yield. Concurrently, we introduce a third price-based factor: “52-Week High Momentum (MOM52WH)”. Taking the Taiwan market as an empirical testbed, this paper examines the predictive capabilities of these three factors and evaluates the practical value of multi-factor fusion through strategy backtests.
Research Design
This study constructs 7 distinct single-, dual-, and triple-factor strategies to evaluate fusion efficacy. The backtesting settings and parameters are as follows:
- Data Sources: TEJ Factor Library, TEJ Stock Pricing Database.
- Universe: Common stocks listed on Taiwan Stock Exchange (TWSE) and Taipei Exchange (TPEx/OTC), excluding Financials (revenue in financial sectors primarily consists of interest and investment income, bearing different accounting semantics for revenue and operating profit margin compared to other industries) and restricted to large-cap equities within the top 50% by market capitalization.
- Sampling Period: January 2015 to June 2026.
- Benchmark Index: Formosa Return Index (IR0078).
- Strategy Definitions: Individual stocks are scored based on their cross-sectional factor rank within the sample. Single-factor strategies directly adopt the respective factor ranking score; multi-factor strategies sum the component factor ranking scores. The top 50 stocks with the highest total scores within the universe are selected and equal-weighted.
- Rebalancing Frequency: Monthly rebalancing (executed on the first trading day following the monthly revenue disclosure deadline).
- Trading Costs and Constraints: Event-driven daily matching; slippage cost of 1 tick per transaction; accounting for Taiwan stock brokerage commissions and Securities Transaction Tax; maximum leverage capped at 90%; excludes stocks locked at limit price at open and disposition securities.
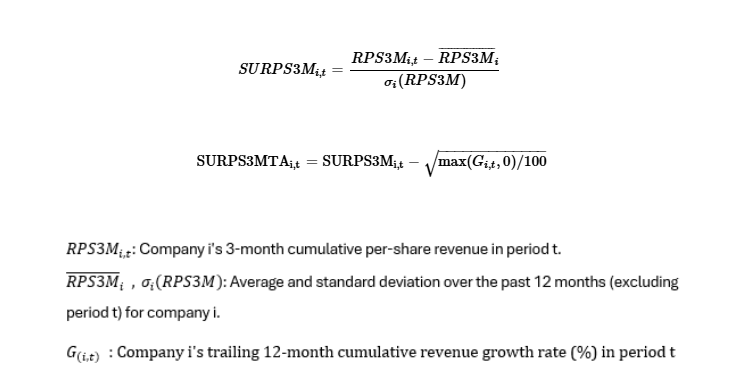
Variable ConstructionSURPS3MTA (Trend-Adjusted Standardized Unexpected 3-Month Cumulative Revenue Per Share): Normalizes 3-month cumulative per-share revenue relative to its historical 12-month baseline and deducts the long-term trend component. It measures “how much better current revenue is compared to historical normal levels” while removing pre-anticipated growth trajectories, focusing strictly on capturing revenue surprises.
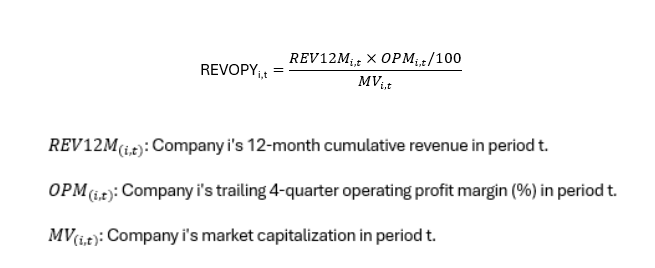
REVOPY (Monthly Revenue Estimated Operating Profit to Market Value Ratio): Essentially an “operating profit yield” factor; higher values indicate cheaper market valuations given the company’s earnings.
MOM52WH (52-Week High Momentum): Calculated by dividing current stock price by its 52-week high price. Investors often treat previous highs as psychological anchor points, becoming hesitant to chase price rallies and leading to underreaction to positive news. Consequently, the closer the stock price is to its 52-week high, the higher its subsequent returns tend to be.
Descriptive Statistics
To investigate the cross-sectional distribution of factor values, stocks are sorted by factor values from smallest to largest into ten equal deciles (P1 lowest to P10 highest) on each trading day, as shown in Table 3-3.
SURPS3MTA is a standardized score with concentrated distribution, exhibiting heavy tails only in the extreme decile (P10) due to denominators approaching zero. REVOPY is a ratio metric, where middle deciles (P5–P7) show estimated operating profit yields around 4%–7%. Deciles P1 to P3 yield negative mean values, encompassing companies with negative estimated operating profits.
Table 3-3: Descriptive Statistics of Core Factor Deciles
Panel A: SURPS3MTA
elds around 4%–7%. Deciles P1 to P3 yield negative mean values, encompassing companies with negative estimated operating profits.
Table 3-3: Descriptive Statistics of Core Factor Deciles
| Panel A: SURPS3MTA | ||||||
| Decile | Minimum (Min) | Maximum (Max) | Mean | Standard Deviation (Std) | Observations (Count) | Percentage (%) |
| P1 | −225.83 | −0.97 | −2.72 | 3.45 | 463,331 | 10.03 |
| P2 | −3.11 | −0.42 | −1.53 | 0.42 | 461,930 | 10.00 |
| P3 | −2.45 | 0.00 | −1.09 | 0.40 | 461,764 | 9.99 |
| P4 | −2.02 | 0.37 | −0.75 | 0.41 | 461,884 | 10.00 |
| P5 | −1.72 | 0.66 | −0.42 | 0.43 | 462,294 | 10.00 |
| P6 | −1.39 | 0.95 | −0.08 | 0.45 | 461,389 | 9.98 |
| P7 | −1.05 | 1.34 | 0.28 | 0.46 | 461,657 | 9.99 |
| P8 | −0.67 | 1.85 | 0.70 | 0.46 | 462,012 | 10.00 |
| P9 | −0.22 | 2.64 | 1.23 | 0.46 | 461,612 | 9.99 |
| P10 | 0.46 | 9314.86 | 2.99 | 19.67 | 463,091 | 10.02 |
| Panel B: REVOPY | ||||||
| Decile | Minimum (Min) | Maximum (Max) | Mean | Standard Deviation (Std) | Observations (Count) | Percentage (%) |
| P1 | −238.0061 | −0.0430 | −0.2348 | 1.7790 | 459,587 | 10.03 |
| P2 | −0.1359 | −0.0019 | −0.0429 | 0.0206 | 458,217 | 10.00 |
| P3 | −0.0399 | 0.0253 | −0.0043 | 0.0105 | 457,938 | 9.99 |
| P4 | −0.0010 | 0.0467 | 0.0195 | 0.0091 | 458,251 | 10.00 |
| P5 | 0.0144 | 0.0673 | 0.0381 | 0.0095 | 458,494 | 10.00 |
| P6 | 0.0281 | 0.0876 | 0.0541 | 0.0102 | 457,571 | 9.98 |
| P7 | 0.0414 | 0.1094 | 0.0689 | 0.0109 | 457,980 | 9.99 |
| P8 | 0.0534 | 0.1317 | 0.0840 | 0.0122 | 458,101 | 10.00 |
| P9 | 0.0663 | 0.1720 | 0.1035 | 0.0155 | 457,868 | 9.99 |
| P10 | 0.0839 | 3.3816 | 0.1641 | 0.1168 | 459,206 | 10.02 |
Return Performance and Risk Factor Testing (Fama-French Alpha)
Table 3-4 details average forward returns (converted to daily equivalent return rates) and long-short spread returns (Spread = P10 − P1) for deciles of the two core factors across different holding periods.
Average forward returns and decile cumulative returns across holding periods are summarized in the charts. Return analysis shows that SURPS3MTA exhibits perfect monotonic increasing properties with positive long-short spread (P10−P1) returns. Conversely, REVOPY decile returns display compressed flattening; P10 exhibits no absolute dominance, and P1 cumulative returns crossed upward above middle deciles post-2021 (Figure 3-7).
Table 3-4: Average Forward Returns of Core Factor Deciles Across Holding Periods
| Panel A: SURPS3MTA | ||||
| Decile | 1D | 5D | 10D | 21D |
| P1 (Bottom) | −0.018% | 0.004% | 0.007% | 0.009% |
| P2 | 0.009% | 0.023% | 0.023% | 0.023% |
| P3 | 0.010% | 0.022% | 0.024% | 0.026% |
| P4 | 0.026% | 0.036% | 0.038% | 0.043% |
| P5 | 0.038% | 0.045% | 0.046% | 0.046% |
| P6 | 0.044% | 0.050% | 0.052% | 0.056% |
| P7 | 0.063% | 0.067% | 0.068% | 0.068% |
| P8 | 0.092% | 0.091% | 0.090% | 0.091% |
| P9 | 0.113% | 0.104% | 0.101% | 0.101% |
| P10 (Top) | 0.168% | 0.132% | 0.124% | 0.116% |
| Spread (P10−P1) | 0.187% | 0.128% | 0.117% | 0.107% |
| Panel B: REVOPY | ||||
| Decile | 1D | 5D | 10D | 21D |
| P1 (Bottom) | 0.054% | 0.064% | 0.064% | 0.065% |
| P2 | 0.043% | 0.049% | 0.049% | 0.051% |
| P3 | 0.042% | 0.049% | 0.049% | 0.050% |
| P4 | 0.053% | 0.055% | 0.056% | 0.058% |
| P5 | 0.055% | 0.060% | 0.059% | 0.061% |
| P6 | 0.053% | 0.057% | 0.055% | 0.056% |
| P7 | 0.052% | 0.057% | 0.056% | 0.056% |
| P8 | 0.062% | 0.064% | 0.065% | 0.066% |
| P9 | 0.068% | 0.066% | 0.064% | 0.063% |
| P10 (Top) | 0.066% | 0.059% | 0.056% | 0.055% |
| Spread (P10−P1) | 0.012% | −0.004% | −0.008% | −0.010% |
Figure 3-5: Average Forward Return of Core Factor Deciles Across Four Holding Periods (Daily Equivalent)

Figure 3-6: Cumulative Return Curves of SURPS3MTA Deciles (1-Day Holding, Daily Rebalancing)

Figure 3-7: Cumulative Return Curves of REVOPY Deciles (1-Day Holding, Daily Rebalancing)

Risk Factor Model Regression
Monthly returns of the long-short portfolio (P10 − P1) were regressed against CAPM, Fama-French Three-Factor (FF3), and Five-Factor (FF5) models to evaluate intercept (Alpha) significance.
Results indicate that after controlling for known risk factors, SURPS3MTA delivers a statistically significant FF5 Alpha of 1.81% (unabsorbed by market, size, value, or profitability factors), whereas REVOPY exhibits weak Alpha in long-short spread regressions (marginally significant at -0.46%).
Table 3-8: Risk Factor Model Regression Alpha of Core Factors P1, P10, and Long-Short Portfolios
Panel A: SURPS3MTA
| Panel A: SURPS3MTA | |||
| Model | P1 | P10 | Long-Short (P10−P1) |
| CAPM | −0.94%*** (−3.73) | 0.89%*** (3.85) | 1.83%*** (10.05) |
| FF3 | −1.13%*** (−10.71) | 0.68%*** (4.68) | 1.81%*** (10.25) |
| FF5 | −1.11%*** (−9.01) | 0.70%*** (4.06) | 1.81%*** (8.07) |
| Panel B: REVOPY | |||
| Model | P1 | P10 | Long-Short (P10−P1) |
| CAPM | 0.14% (0.38) | 0.04% (0.15) | −0.10% (−0.35) |
| FF3 | −0.20% (−1.13) | −0.23% (−1.43) | −0.03% (−0.12) |
| FF5 | 0.07% (0.33) | −0.39%** (−2.25) | −0.46%* (−1.70) |
Information Coefficient Analysis
Measuring via Information Coefficient (IC) reveals an “IC vs. Alpha divergence” phenomenon: REVOPY outperforms SURPS3MTA in IC metrics (21D reaches 0.0604 vs 0.0577), yet its long-short Alpha is only marginally significant. This is because REVOPY’s predictive information spreads evenly across the entire cross-section rather than concentrating in extreme deciles (P1, P10); thus, purely longing P10 substantially underestimates its ranking value.
Table 3-9: Statistical Summary of Core Factor Information Coefficients (IC) Across Holding Periods
| Panel A: SURPS3MTA | ||||
| Metric | 1D | 5D | 10D | 21D |
| IC Mean | 0.0191 | 0.0331 | 0.0431 | 0.0577 |
| IC Std | 0.0572 | 0.0599 | 0.0605 | 0.0611 |
| Risk-Adjusted IC | 0.334 | 0.552 | 0.713 | 0.944 |
| IC > 0 (%) | 64.1 | 72.4 | 76.7 | 83.9 |
| IC t-value (Newey-West) | 16.50 | 14.38 | 14.47 | 13.39 |
| IC Mean (Size-Neutral) | 0.0183 | 0.0317 | 0.0417 | 0.0566 |
| IC Mean (Industry-Neutral) | 0.0184 | 0.0308 | 0.0395 | 0.0519 |
| Panel B: REVOPY | ||||
| Metric | 1D | 5D | 10D | 21D |
| IC Mean | 0.0307 | 0.0466 | 0.0532 | 0.0604 |
| IC Std | 0.0583 | 0.0717 | 0.0784 | 0.0851 |
| Risk-Adjusted IC | 0.526 | 0.651 | 0.679 | 0.709 |
| IC > 0 (%) | 70.7 | 74.9 | 76.6 | 76.7 |
| IC t-value (Newey-West) | 21.94 | 15.50 | 13.15 | 9.78 |
| IC Mean (Size-Neutral) | 0.0252 | 0.0370 | 0.0428 | 0.0502 |
| IC Mean (Industry-Neutral) | 0.0273 | 0.0424 | 0.0487 | 0.0552 |
Table 3-9 presents overall sample period averages, masking whether predictive power accumulates steadily or concentrates in specific years. Figure 3-10 plots 21-day holding period ICs cumulatively over time: SURPS3MTA cumulative IC rises at a steady pace, whereas REVOPY exhibits stagnation during 2020.
Figure 3-10: Cumulative Information Coefficients of Core Factors at 21-Day Holding Period
