

Insights
In-depth research and data-driven insights on quantitative finance, factor investing, risk, and ESG from the TEJ research team.
Trending
Editor's picks from our research desk.

Fundamental Factor Research: Monthly Revenue Information – part1
The Taiwan equity market possesses a rare institutional advantage globally: under the Securities and Exchange Act, listed companies are required to announce and report their operational results for the preceding month by the 10th of each month (Exception: starting from FY2026, insurance companies and entities with insurance subsidiaries may extend their disclosure deadline to the 15th of each month). This is commonly referred to in the market as "Monthly Revenue".
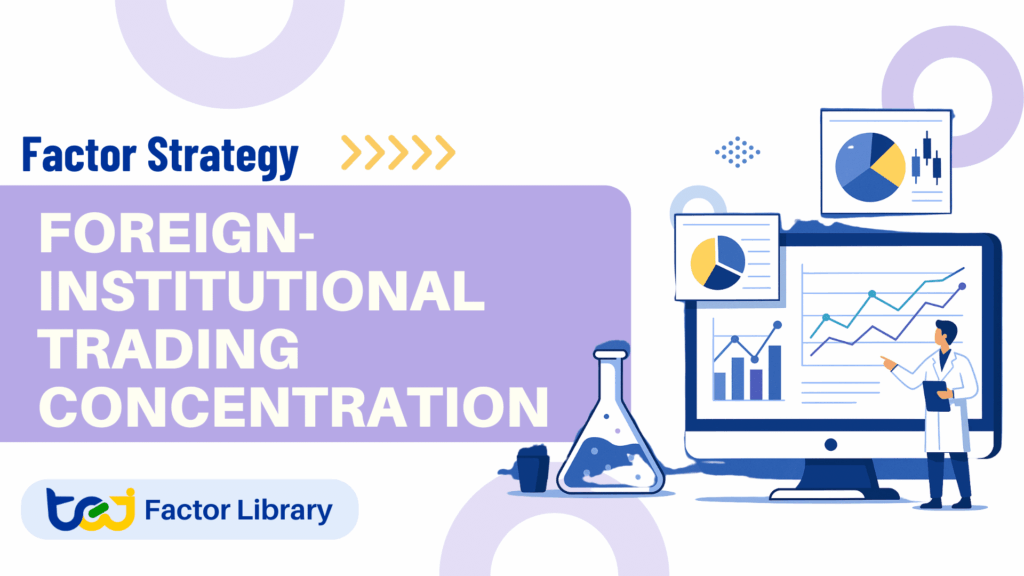
Factor Strategy – Integrating Broker Consensus to Enhance Foreign Concentration Strategies – QFII Part 2
Boost your quantitative strategy with QFII concentration & broker consensus! Discover how the conc_qfii fusion strategy delivers a 30.12% annualized return in the Taiwan large-cap market.
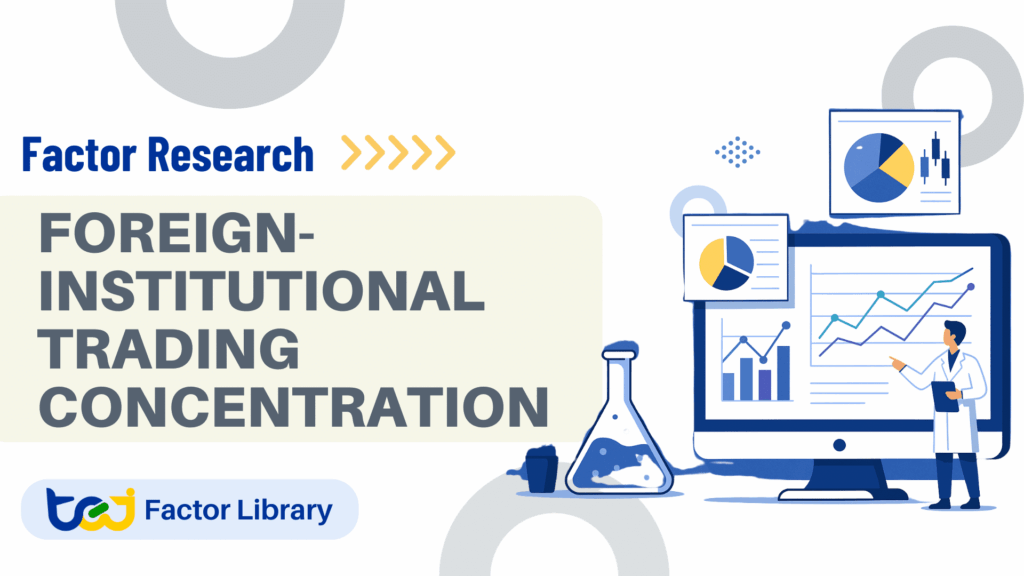
Factor Research – Tracking Smart Money Footprints via Foreign Institutional Concentration – QFII Part 1
Track QFII ‘smart money’ footprints in Taiwan large-cap stocks! Learn how the Foreign-Institutional Trading Concentration (conc_qfii) factor predicts returns.
Insights
Browse all articles by topic.
 Event & Alternative Signals
TCRI Watchdog Part2:How Different Types of Corporate Events Shape Market Reactions
TCRI Watchdog classifies all events into 5 major categories: Accounting, Industry Prospects, Management & Governance, Market Transactions, and Crisis Events. We analyze how each category affects stock prices, compare their reaction magnitudes and persistence, and highlight which types of information serve as the most important early-warning signals for investors.
 Event & Alternative Signals
How Major Announcements Drive Stock Price Volatility:Event Study of the TCRI Watchdog “P” Type Event-Part 1
Discover how TCRI Watchdog quantifies material announcements and reveals the asymmetric market impact of event intensity. Learn why negative events drive deeper, longer price reactions and how investors can use event-based signals to enhance risk monitoring and strategy design. We find that higher-ranked portfolios deliver significant short-term excess returns, while predictive power weakens over longer horizons. The results highlight the practical value of Point-in-Time financial data for quantitative factor investing and underscore its role in building replicable, data-driven investment strategies.
 Factor Investing
Discovering Investment Factors through Point-in-Time Audited Financial Database
This study employs TEJ’s Point-in-Time Audited Financial Database to construct a composite factor for stock selection in Taiwan’s equity market. By preserving financial data exactly as available at each historical moment, the framework avoids look-ahead bias and ensures empirical reliability. We find that higher-ranked portfolios deliver significant short-term excess returns, while predictive power weakens over longer horizons. The results highlight the practical value of Point-in-Time financial data for quantitative factor investing and underscore its role in building replicable, data-driven investment strategies.
 Market Knowledge & Data Guides
TEJ Point-in-Time Audited Financial Database – Rejecting “Peek-ahead” Backtesting
TEJ PIT Audited Financial Database eliminates look-ahead and survivorship bias with Point-in-Time data, full version retention, IFRS alignment, and 300+ ready-to-use ratios—delivering reliable backtesting and faster strategy development.
 Market Knowledge & Data Guides
What is Market Data: Meaning, Types, Examples, Pros, & Cons
What is market data? Learn about its definition, types, sources, and applications to leverage it for informed decision-making in trading and investment.
 Quant Data Science
How to avoid common mistakes during trading – Loss Avoidance
“Loss avoidance” is a crucial topic in investing, whether for novice investors or experienced experts. As we pursue investment returns, the risk of losses is ever-present. Therefore, adopting effective loss avoidance strategies is vital to protect our capital and enhance the chances of investment success. In this article, we will use Python and the tejapi to fetch stock price data to examine the differences between implementing loss avoidance and without loss avoidance measures. By understanding and applying loss avoidance, we will be better equipped to protect our investments, reduce potential losses, and enhance long-term returns.
 Market Knowledge & Data Guides
What is the Look-ahead Bias ?
Look-ahead bias is the phenomenon that unconsciously uses unavailable or unrevealed data in analyzing or simulating historical events. It exists in the processes of making decisions or evaluations which use information or data that was unknown at that time. Look-ahead bias may cause distortion and misleadingness of the result because it violates the principle of using only information available during analysis. It could emerge in any field, such as finance, economy, and data analysis, and influence investment strategy, backtesting of the trading system, and performance grading.
 Market Knowledge & Data Guides
Survivorship Bias
Highlights Preface Survivorship bias refers to a type of error in research or observation where only the successful or surviving entities or events are considered, while the failures or disappearances are ignored or excluded. This bias can lead to a misunderstanding of the overall situation because observing only the successful or surviving entities may not […]
 Market Knowledge & Data Guides
Use TEJ Point-in-Time data to explore the connotation of monthly revenue information
According to the Security and Exchange Act, within the first ten days of each calendar month publicly announce and register with the Competent Authority the operating status for the month. In addition to the real-time information of monthly revenue compared with financial reports, it can also assist investors in tracking company fundamentals during the window period of yearly financial reports. Therefore, monthly revenue information has become one of the most important reference indicators for investors to grasp changes in the company’s fundamentals.