

Preface
In today’s financial world, quantitative finance is increasingly gaining traction. According to Goldman Sachs, over 70% of U.S. stock trades in the first half of 2024 were executed via algorithms, underscoring the sheer scale of algorithmic trading. On the other hand, Taiwan’s stock market, fueled by the AI boom, saw an average daily trading volume of NT$420 billion in the first half of 2024. However, algorithmic trading accounted for just NT$2.8 billion per day—only 0.6% of the total.
Is algorithmic trading really that distant from us? In reality, the proportion of algorithmic trading in Taiwan’s market has been growing at an annual rate of 20%. This article introduces the algorithmic trading API from SinoPac Securities:Shioaji. Its native Python ecosystem makes coding accessible and enables SinoPac’s API to capture roughly half of Taiwan’s algorithmic trading market share. Through the TQuant Lab SuperTrend Strategy, we’ll demonstrate how to swiftly master algorithmic trading, setting you on the path to becoming a pioneer in Taiwan’s market.
Overview of the SuperTrend Strategy
The SuperTrend Strategy combines the SuperTrend Indicator and the ADX Indicator. The SuperTrend Indicator consists of upper and lower bands. When the stock price breaks above the upper band, it signals a breakout, indicating a potential upward trend. Conversely, when the price drops below the lower band, it indicates a breach of support and a potential downward trend.
The ADX (Average Directional Index), ranging from 0 to 100, measures trend strength. Higher values signify stronger trends, helping confirm bullish or bearish conditions.
Entry and Exit Rules for the SuperTrend Strategy:
- Long Entry:When the closing price breaks above the upper band, signaling a breakout and a potential bullish trend, buy the stock.
- Short Entry:When the closing price falls below the lower band and ADX > 50, indicating a bearish trend, sell the stock.
For a detailed explanation of the strategy and the backtesting process in TQuant Lab, refer to the guide on SuperTrend Strategy: Buy Low, Sell High to Profit from Market Swings.
Identifying Daily Trading Targets
Building the Stock Universe
Given the characteristics of the SuperTrend Indicator, we aim to select stocks with growth potential and trend-forming tendencies.
The selection process includes:
- Using
get_calendarto retrieve the previous trading date. - Using
get_universeto fetch the list of electronic industry stocks listed on that day. - Filtering the top 100 stocks by market capitalization using the TEJ Tool API.
Selecting Trading Targets
The following three steps outline the process of filtering daily trading targets for the SuperTrend Strategy.
- We import three months of price and volume data for the selected 100 stocks from TEJ database.
- Calculate the SuperTrend and ADX indicators through
CustomFactorandPipelinefunctions. - By applying the strategy’s entry and exit conditions to the most recent data, we generate buy_list and sell_list.


Start Building Portfolios That Outperform the Market!
Algorithmic Trading with SinoPac API
Setup
Install the Shioaji package using pip:
pip install shioajiBefore using the Sinopac API, you must open a securities account with Sinopac Securities, apply for an API key and certificate, and agree to the terms of service. Detailed instructions can be found in the documentation linked above.
Logging in to Sinopac API
This guide uses Shioaji in simulation mode. Import the shioaji package and log in with your api_key and secret_key to access the Sinopac API environment.
import shioaji as sj

api = sj.Shioaji(simulation=True) # Simulation mode
api.login(
    api_key = 'your api_key',
    secret_key = 'your secret_key',
    contracts_cb=lambda security_type: print(f"{repr(security_type)} fetch done.") # Fetch Contracts Callback
)
Retrieving Current Holdings
The list_positions function in Sinopac API provides current holdings, including stock symbols, quantities, average prices, current prices, and profit/loss, etc.
Note: If no positions are held, the function returns an empty DataFrame
positions = api.list_positions(api.stock_account)
position_data = pd.DataFrame(s.__dict__ for s in positions)
position_data
Extracting the code column from the position data will provide the current list of held stocks, referred to as hold_list.
if position_data.empty:
    hold_list = []
else:
    hold_list = position_data['code'].to_list()
Setting Up Order Callback
We define the order callback function order_cb and pass it to set_order_callback. Once an order is executed, it will return order details and trade execution messages.
def order_cb(stat, msg):
    print('my_order_callback')
    print(stat, msg)

api.set_order_callback(order_cb)
Placing Orders
The place_order function is used to execute trades. It requires contract (stock information) and order (trade details). Key parameters include action (Buy/Sell), quantity, price type (MKT, MKP), order type (ROD, IOC, FOK), and order lot (Common, Odd), etc.
The trading rules in this article are as follows:
- If a stock in the buy_list is not in the hold_list, a MKT order will be placed to buy one share.
- If a stock in the sell_list is in the hold_list, a MKT order will be placed to sell one share.
We automate the order placement process using a loop, demonstrated here with the buying procedure:
for i in buy_list:
    print('processing %s' % i)

    if i not in hold_list:
        print('%s not in hold_list' % i)
        print('Ready to buy!')

        contract = api.Contracts.Stocks.TSE[i]

        order = api.Order(
            action = 'Buy',
            price = 0, # MKT, MKP will not use price parameter
            quantity = 1,
            price_type = 'MKT', # MKT or MKP
            order_type = 'IOC', # ROD, IOC, FOK
            order_lot = 'Common', # Common:整股, Fixing:定盤, Odd:盤後零股, IntradayOdd:盤中零股
            account = api.stock_account
        )

        trade = api.place_order(contract, order)
        trade

    else:
        print('%s in hold_list' % i)

    print('=' * 100)

Viewing Realized P&L
The list_profit_loss function provides realized profit/loss data for a specified date range, including stock symbols, prices, quantities, and profit/loss details
profitloss = api.list_profit_loss(api.stock_account,'2024-10-28','2024-10-28')
profitloss_data = pd.DataFrame(pnl.__dict__ for pnl in profitloss)
profitloss_data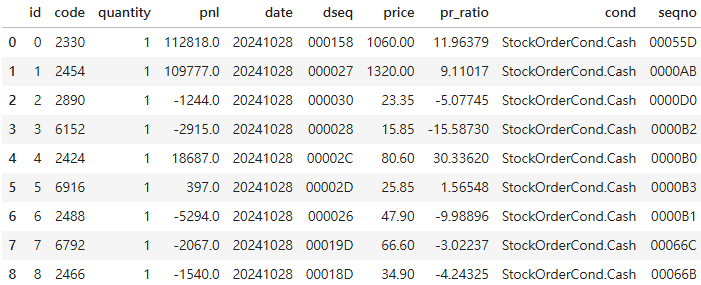
Logging Out
Due to API usage limits, it’s recommended to log out after completing your operations
api.logout()
# True
Conclusion
This article demonstrates how to integrate the Sinopac API with TQuant Lab to implement the SuperTrend Strategy, achieving algorithmic trading. The advantages of algorithmic trading are evident: once the trading strategy and execution environment are set up, running the script on rebalancing days automates the entire process, from placing orders to tracking portfolio performance, significantly reducing manual intervention and time costs.
Beyond the features covered here, the Sinopac API offers many other functionalities for users to explore. Those interested can consult the Shioaji Documentation to dive deeper into algorithmic trading!
Please note that the strategy and target discussed in this article are for reference only and do not constitute any recommendation for specific commodities or investments.
Why TEJ Data Supports Taiwan Market Investments
TEJ provides extensive, high-quality financial data covering the Taiwan stock market, tailored for market trend analysis. As the Taiwan Stock Exchange recently peaked due to rising semiconductor stocks, TEJ’s data allows investors to monitor trends closely and craft strategies tailored to Taiwan’s unique market dynamics.
Taiwan Economic Journal (TEJ), a financial database established in Taiwan for over 30 years, serves local financial institutions and academic institutions, and has long-term cooperation with internationally renowned data providers, providing high-quality financial data for five financial markets in Asia.
- Complete Coverage: Includes all listed companies on stock markets in Taiwan, China, Hong Kong, Japan, Korea, etc.
- Comprehensive Analysis of Enterprises: Operational aspects, financial aspects, securities market performance, ESG sustainability, etc.
- High-Quality Database: TEJ data is cleaned, checked, enhanced, and integrated to ensure it meets the information needs of financial and market analysis.
With TEJ’s assistance, you can access relevant information about major stock markets in Asia, such as securities market, financials data, enterprise operations, board of directors, sustainability data, etc., providing investors with timely and high-quality content!