
Observing TESG Ratings Distribution over the Past Five Periods
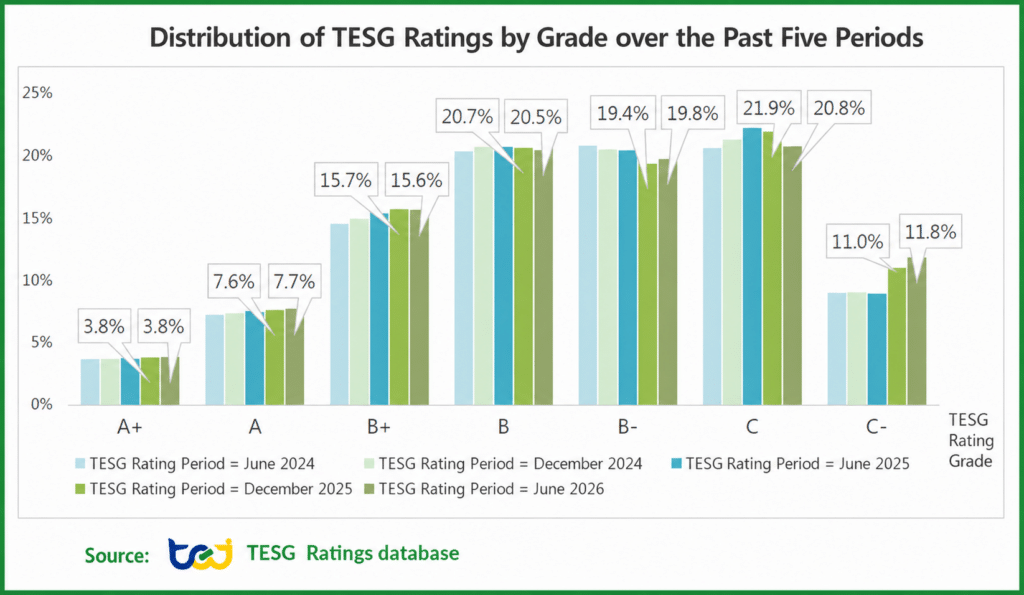
Taiwan Economic Journal (TEJ) released the latest TESG Ratings results on May 4, 2026. This round of TESG ratings covers a total of 2,559 companies, with 41 newly added samples. Looking at the rating structure over the past five periods, the proportion of leading companies, rated A+ and A, has shown a steady and modest upward trend. Meanwhile, the share of companies rated C- has also increased over the past two periods, rising from 8.9% in the first half of 2025 to 11% in the second half of 2025, and further to 11.8% in the first half of 2026, as shown in Figure 1.
TEJ’s ESG Sustainability Consulting Services team explains that the TESG ratings distribution is constructed based on a percentile-based classification mechanism, resulting in an overall normal distribution concentrated in the middle tiers. Therefore, changes in the proportion of each rating category mainly reflect shifts in companies’ relative rankings rather than absolute changes in sustainability performance. To gain a more comprehensive understanding of ESG development trends, it is recommended to analyze TESG score changes together with upgrade and downgrade patterns, thereby improving the accuracy and insightfulness of interpretation.
| ategory | Description |
|---|---|
| Momentum | Captures the persistence in both price and fundamental performance of a firm. |
| Dividend Yield | Captures the excess returns associated with high-dividend stocks and reflects a firm’s dividend policy and capital return strategy. |
| Value | Reflects undervaluation relative to fundamentals and potential for excess returns. |
| Growth | Reflects the growth potential of a company’s earnings and revenues, and captures excess returns from high-growth stocks. |
| Quality | Reflects a company’s financial strength and operational soundness, and captures excess returns from high-quality stocks. |
| Liquidity | The liquidity factor measures trading ease. Stocks with lower liquidity often entail higher costs, leading to potential excess returns. |
| Volatility | Measures the uncertainty in stock prices or returns, and captures the excess returns associated with low-risk stocks (as measured by volatility, beta, or idiosyncratic risk). |
| Size | Captures the relationship between a firm’s market capitalization and its returns. |
| Sentiment | Captures the impact of investor behavior and psychological expectations on stock prices. |
| Credit Risk | Measures the probability of corporate default or bankruptcy. |
| Machine Learning | Utilizes statistical algorithms and AI techniques to extract non-linear features and complex patterns from high-dimensional data, aiming to enhance asset pricing or return prediction accuracy. |
| Momentum | Captures the persistence in both price and fundamental performance of a firm. | Description | |||
|---|---|---|---|---|---|
| Dividend Yield | Captures the excess returns associated with high-dividend stocks and reflects a firm’s dividend policy and capital return strategy. | ||||
| Value | Reflects undervaluation relative to fundamentals and potential for excess returns. | ||||
| Growth | Reflects the growth potential of a company’s earnings and revenues, and captures excess returns from high-growth stocks. | ||||
| Quality | Reflects a company’s financial strength and operational soundness, and captures excess returns from high-quality stocks. | ||||
| Liquidity | The liquidity factor measures trading ease. Stocks with lower liquidity often entail higher costs, leading to potential excess returns. | ||||
| Volatility | Measures the uncertainty in stock prices or returns, and captures the excess returns associated with low-risk stocks (as measured by volatility, beta, or idiosyncratic risk). | ||||
| Size | Captures the relationship between a firm’s market capitalization and its returns. | ||||
| Sentiment | Captures the impact of investor behavior and psychological expectations on stock prices. | ||||
| Credit Risk | Measures the probability of corporate default or bankruptcy. | ||||
| Machine Learning | Utilizes statistical algorithms and AI techniques to extract non-linear features and complex patterns from high-dimensional data, aiming to enhance asset pricing or return prediction accuracy. |
媒體說明文字
Regulatory Requirements Enhance Transparency: Listed Companies Lead the TESG Ratings, While OTC Governance Still Needs Strengthening
By market category, TESG rating distribution shows clear differences from 2024 sustainability report disclosure rates. Listed and OTC companies generally performed better, with a higher share of leading ratings (A+ and A) and most companies concentrated in the B+ to B range, indicating relatively mature sustainability management. Their disclosure rates reached 97.8% and 96.9%, reflecting high information transparency.